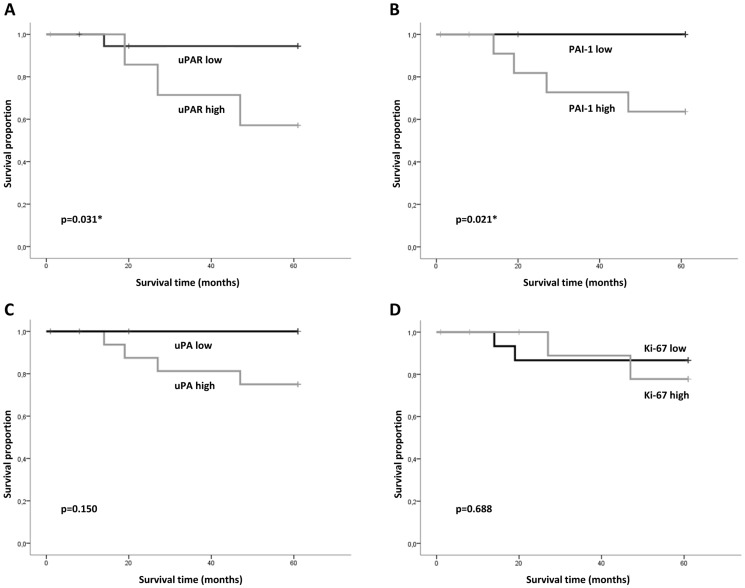
Figure 5. Disease specific survival of patients with T1N0 tumours.
Kaplan-Meier survival plot showing probability for a disease specific survival based on A) uPAR, B) PAI-1, C) uPA and D) Ki-67 expression and related to months after diagnosis. Total number of patients included in the analysis was 27 for uPAR and Ki-67, and 26 for PAI-1 and uPA. *; p<0.05 was regarded as statistically significant.

