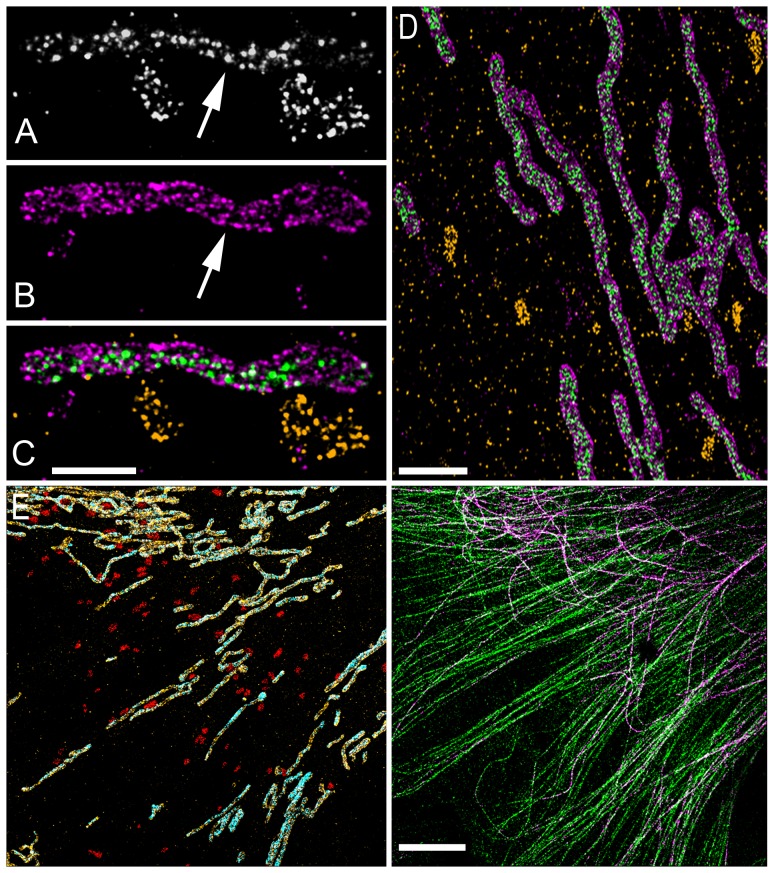
Figure 3. Multi-color STORM imaging using overlapping antibody species.
(A) An image of ATP-synthase (localized to mitochondria) and LAMP2 (localized to lysosomes) both labelled using a mouse monoclonal primary and anti-mouse secondary antibody and imaged at the same time. (B) An image of Tom20, a mitochondrial outer membrane protein. Since Tom20 and ATP-synthase colocalize on mitochondria (arrows), the colocalization can be used to separate the initial image into separate colors. (C) ATP-synthase is identified as those molecules which colocalize with Tom20. Lysosomes are identified as those molecules which do not colocalize with Tom20. (D) A zoom-out of the three color Tom20 (magenta), ATP-Synthase (green), lysosome (orange) STORM image. (E) A five-color STORM image of mitochondrial outer membrane protein Tom20 (orange), mitochondrial inner membrane protein ATP-synthase (cyan), lysosomal protein Lamp2 (red), total tubulin (green) and acetylated tubulin (magenta). The five-color image is split between the two panels to more clearly display the different structures. The acetylated tubulin, ATP-synthase, and Lamp2 are all imaged using mouse primary antibodies. The acetylated tubulin colocalizes with total tubulin and ATP-synthase colocalizes with Tom20; Lamp2 does not colocalize with either total tubulin nor Tom20. Scale bars, 500 nm (C), 2 µm (D) and 5 µm (E).

