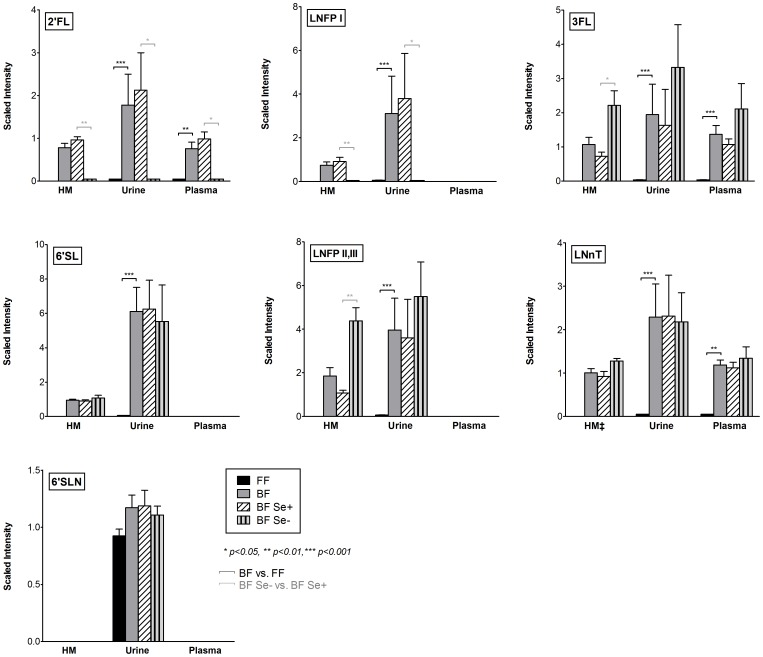
Figure 2. Relative quantitation of HMOs.
Bar plots indicating the relative scaled intensities and Standard error of the mean (SEM) grouped according to feed. (FF vs. BF) and secretor status (BF Se+ vs. BF Se-); (for n, see Table 1). ‡LNnT measurement for breast milk (HM) as LNT, LNnT Isobar; Significant differences were assessed by Mann-Whitney U test where *p<0.05, **p<0.01, and ***p<0.001. Quantitative comparisons between sample matrices and between oligosaccharides cannot be made; quantitative comparisons between samples within a matrix and within individual oligosaccharides are valid.

