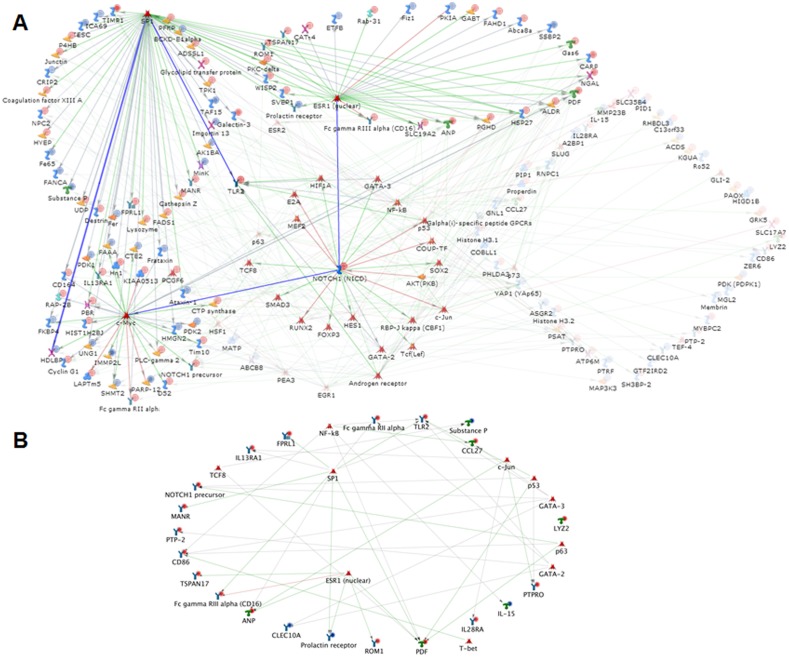
Figure 6. Network analysis of genes significant for genotype: List of significant genes (root list) varying by genotype was uploaded on to GeneGo portal and network built.
Transcription factor network (A) was drawn using analyze network function for transcription factors. In this analysis for every transcription factor with direct ligand (s) in the root list, the algorithm generates a sub-network consisting of all shortest paths from that transcription factor to the closest receptor with direct target (s) in the root list. Receptor networks (B) was drawn using build network for your data option. Except receptors and receptor ligands, others were hidden from this network in order to visualize the alteration in receptor networks. The figure shows the differentially expressed genes in the network (Blue for down-regulated and Red for up-regulated).

