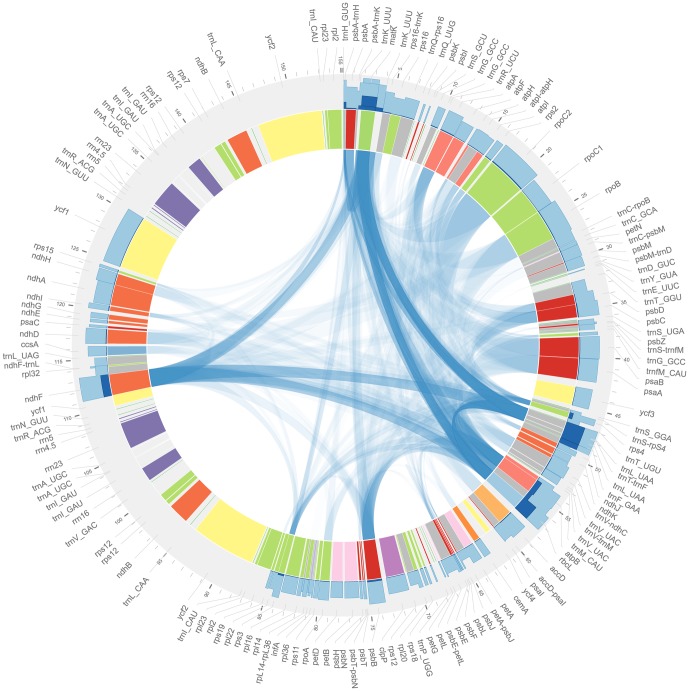
Figure 3. Taxonomic sampling depth and overlap for chloroplast loci in GenBank.
Data shown are representation of genera in GenBank release 185 for all chloroplast loci sampled for this study, superimposed on a genome map of the Coffea arabica genome. Overall generic sampling depth across the chloroplast is quite low. Dark blue bar plots on the outside of the ring show the number of genera  represented by at least one exemplar sequence for each locus, out of
  total genera, while light blue bars show
  , and illustrate relative sampling proportions among loci when absolute proportions are small. Ribbon plots in the center of the figure identify pairs of loci, and indicate the proportion of genera that are represented by exemplar sequences for both loci in the pair. Dark ribbons label locus pairs that are co-represented for many genera; light ribbons label pairs that are co-represented for few. Locus colors correspond to gene groupings by function, and tick marks show linear distance in kilobases. The most well sampled locus in our entire alignment was trnT–trnL–trnF, with 55% of genera represented. Mitochondrial and nuclear loci are not shown in the figure, but the most well-sampled nuclear markers were ITS (53%) and ETS (8%; similar to rps4 in the figure), and for the mitochondrion atpA (7%), rps3 (5%), matR (5%), and atp1 (5%); all other nuclear and mitochondrial markers were sampled for fewer than 4% of genera. Exact counts of genera represented for all markers sampled in this study are available in Table S3.

