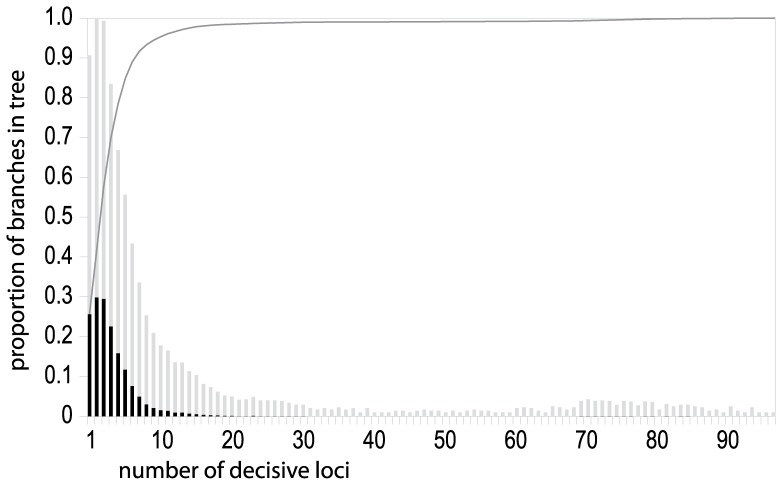
Figure 4. Genetic sampling depth for branches in the ML generic topology of Figs. 1, 5, and 6.
Data shown are the proportion of branches for which each number of loci have decisive taxon sampling. Black bars are actual proportions, and grey bars are square roots of each proportion, which illustrate relative differences when proportions are very small. The dark grey line is the cumulative proportion of branches, which indicates the proportion of branches in the tree for which the number of loci with decisive taxon sampling is less than or equal to the indicated  value. Exact values used to create this figure are presented in Table S2.

