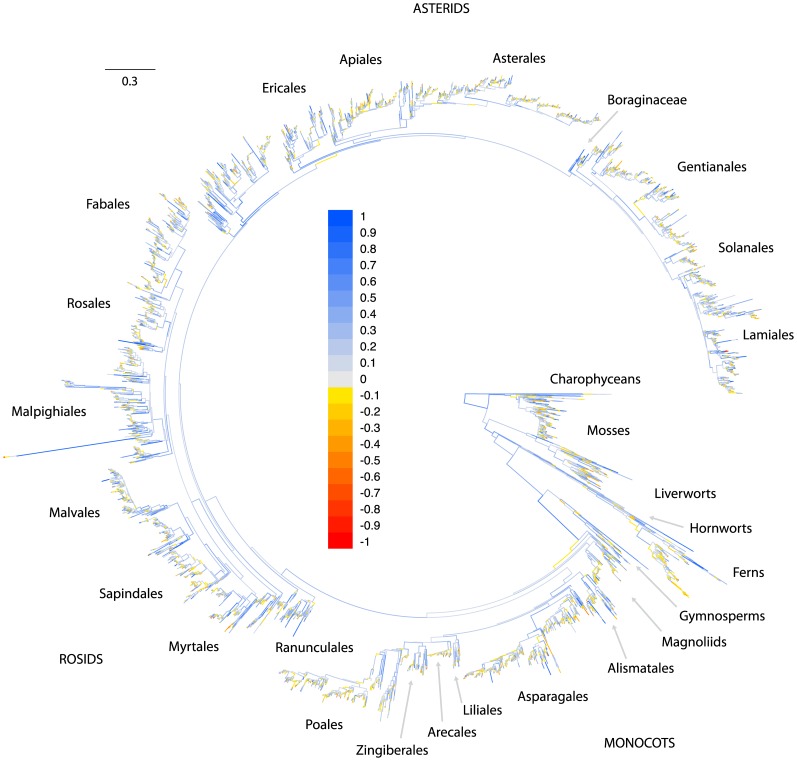
Figure 6. Generic phylogeny of plants with branches colored according to ICA support values.
Branches with strong positive values (high support) are light blue, while branches with low positive values (low support) are gray, and branches with negative values (which imply relatively strong conflicting signal in the data) are colored yellow to red. Most branches deep in the tree are moderately well supported, whereas most strongly supported branches occur within smaller clades, and most branches that appear to be in conflict with the signal from the alignment occur near the tips of the tree. Terminal branches (i.e. tips) were pruned from the tree for display purposes, as they do not have meaningful support values. A large version of this figure with legible tip names is presented in File S3.

