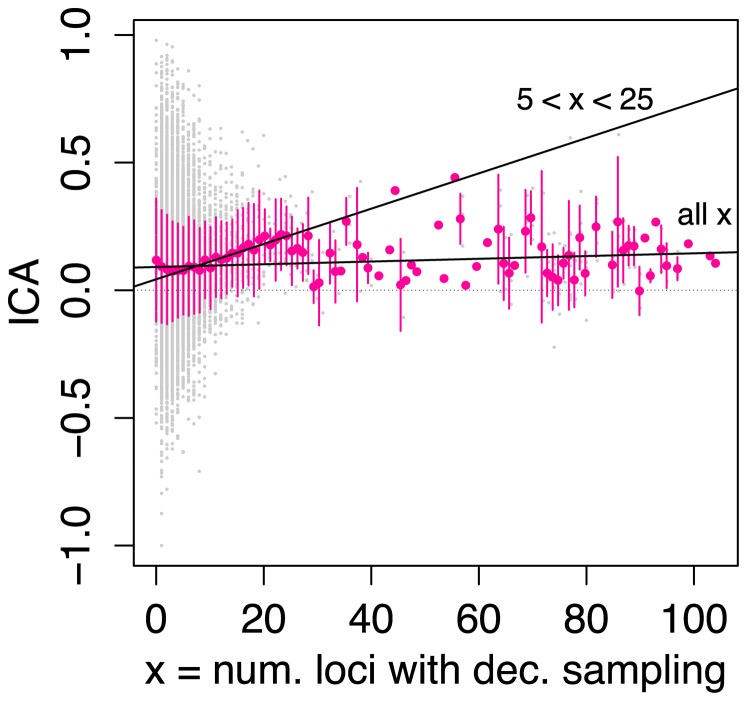
Figure 7. Correlation of branch support (ICA) with locus sampling depth (number of loci with decisive taxon sampling).
Original data points correspond to individual internal branches in the ML topology, and are shown in gray. Large colored dots represent mean ICA values for all branches with the corresponding number of loci with decisive sampling, and error bars extend to plus or minus the standard deviation of the data from each mean. Two regression lines are plotted, one for the entire dataset (labeled “all  ”;
”;  ,
,  ,
,  ,
,  ) and one for only those branches with greater than five but fewer than 25 loci with decisive sampling (labeled “
 ”;
”;  ,
,  ,
,  ,
,  ).
).

