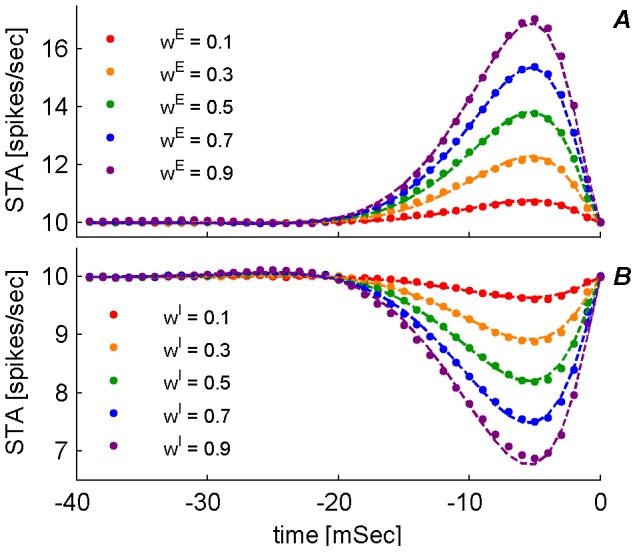
Figure 3. Spike Triggered Average (STA) of a single presynaptic input.

The conditional mean firing rate of the presynaptic cell given that the postsynaptic cell has fired at time  , is plotted as function of time. (A) Excitatory synapse (B) Inhibitory synapse. Each set of dots (color coded) is the conditional mean firing rate calculated over 1000 hours of simulation time with fixed synaptic weights and presynaptic firing rates on all inputs. The different sets correspond to a different presynaptic weight (
 ) on a single synapse on which the STA was measured. The respective dashed lines show the numerical fitting of the form
  where
where  takes the revised formula:
  . For every type of synapse, i.e., excitatory (in A) and inhibitory (in B), the parameters describing
  , namely
  , were chosen to minimize the least square difference between the analytic expression and the numerical estimation of the STA. These parameters were then used to calculate
  .
.
