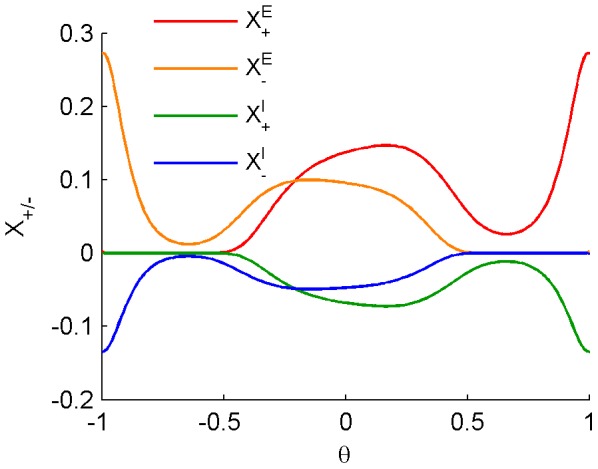
Figure 4. Mean field constants  of equation (11) for the excitatory and inhibitory synapses of the neuronal model used in our numerical simulations, as a function of
  .
.

These values were calculated using numerical integration (see File S1) with  as defined by equations (7) and (8), with
  as set throughout the simulations, and with the fitted formula for
  .
.
