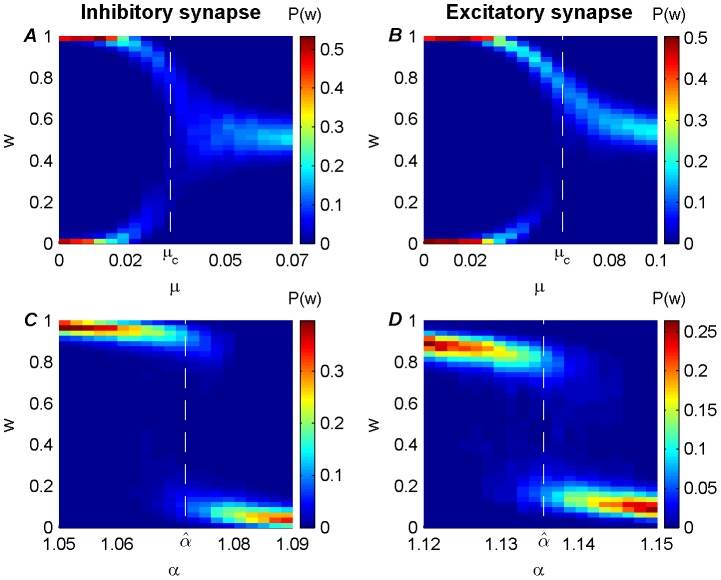
Figure 6. Bifurcation plots along the two parameters ( ) of the weight dependent STDP component,
  (see equations (3) and (4)) near
  of equation (18).
Panels display the synaptic weight distribution (color coded) for the various parameter setups: (A) Inhibitory synapse with anti-Hebbian ( , see also Figure 1F) rule, with fixed
  and varied
  . (B) Inhibitory synapse with anti-Hebbian (
 , see also Figure 1F) rule, with fixed
  and varied
  . (C) Excitatory synapse with Hebbian (
 , see also Figure 1B) rule, with fixed
  and varied
  . (D) Excitatory synapse with Hebbian (
 , see also Figure 1B) rule, with fixed
  and varied
  . The dashed white line marks
  in A and B, and
  in C and D.

