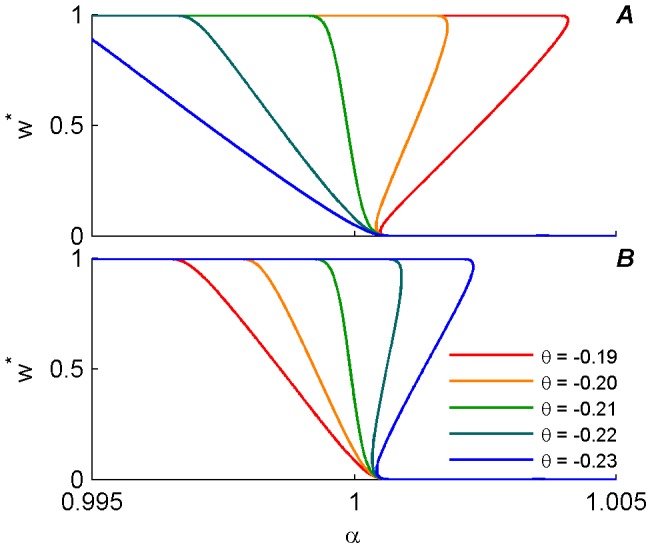
Figure 7. Fixed point solution,  , of the mean field approximation, (plotted using equation (12)), as a function of
  , at
, at  is shown for different values of
  (color coded).

Using  yields continuity of the curves at the extreme values (
 and
and  ), which makes the picture clearer. On the other hand as the value of
  increases the unstable regime of
  gets smaller and the resolution for
  steps plotted should decrease. Thus, to plot these lines, we used
  which is sufficiently close to 0 to illustrate the phase transition with high accuracy in
  . (A) Excitatory synapse. (B) Inhibitory synapse
