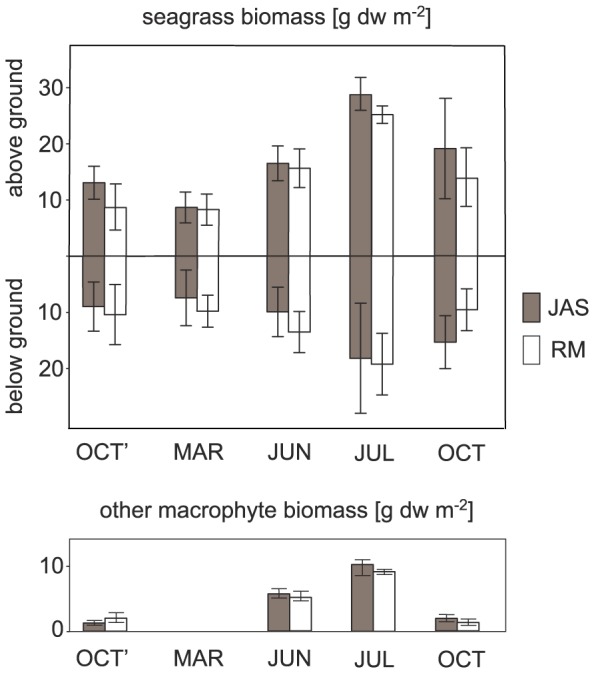
Figure 2. Seasonal variability in macrophyte vegetation characteristics.

Seagrass aboveground and underground biomass and other macrophyte biomass [g dw m−2] recorded in 5 months (OCT' - October 2010, MAR - March 2011, JUN - June 2011, JUL - July 2011, OCT - October 2011) at two sampling stations (JAS - gray bars, RM - white bars). Mean and 0.95 CI values are presented. Based on data published by Jankowska et al. [20].
