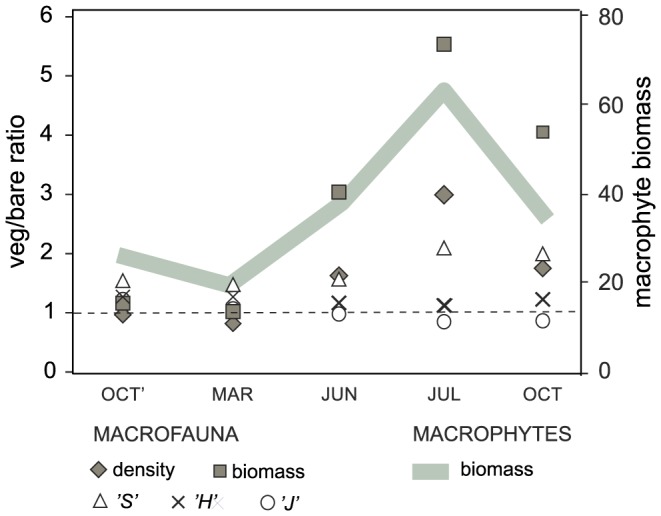
Figure 4. Magnitude of difference in macrofauna univariate characteristics between two bottom types plotted against total macrophyte biomass [g dw m−2].

Veg/bare ratio - ratio of mean recorded on vegetated bottom to mean on bare sand, for samples collected in 5 months (OCT'- October 2010, MAR - March 2011, JUN - June 2011, JUL - July 2011, OCT - October 2011). Veg/bare ratio presented for density, biomass, number of species per sample (‘S’), Shannon-Wiener index (‘H’), Pielou index (‘J’).
