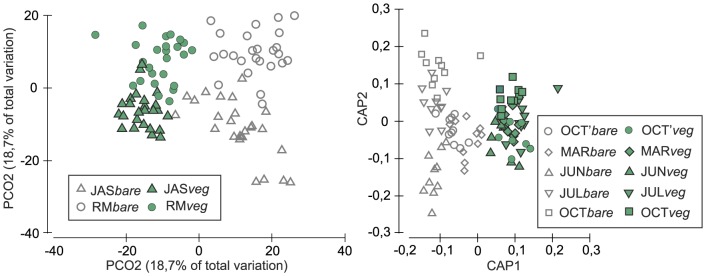
Figure 6. PCO of Bray-Curtis similarities of macrobenthic species abundances in samples (left) and CAP - ordination best discriminating groups of samples defined by bottom types and months (right).

Data were double root transformed. Symbols represent sites/bottom types (left) and months/bottom types (right).
