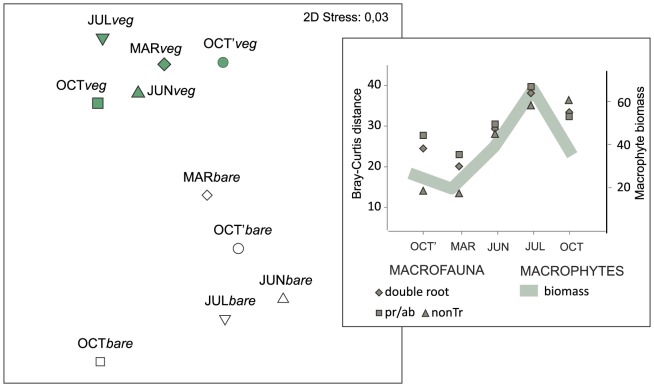
Figure 7. Magnitude of difference in macrofauna community composition between two bottom types in different seasons.
nMDS of Bray-Curtis similarities among centroids for groups of samples collected in different months/bottom types (veg - vegetated bottom, bare - bare sand). Right plot presents Bray-Curtis distances between centroids representing the fauna collected from two bottom types plotted against total macrophyte biomass [g dw m−2] in 5 months. Macrobenthic dissimilarity calculated based on: presence/absence data (pr/ab), double root transformed, and untransformed data (nonTr).

