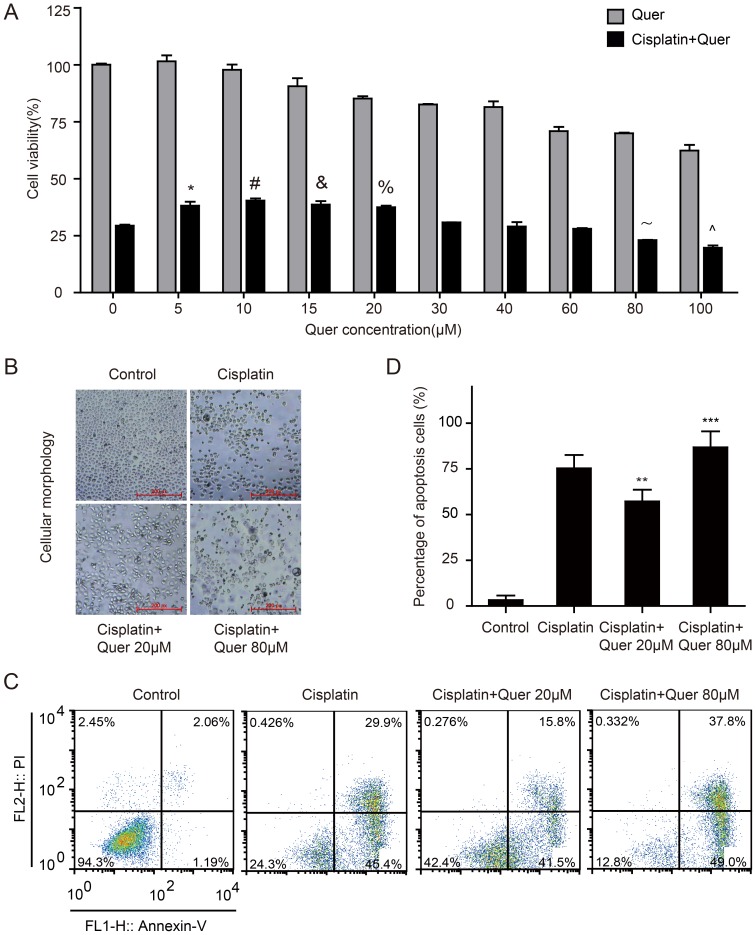
Figure 1. Quercetin in combination with Cisplatin impacts the survival of ovarian cancer C13* cells.
(A), Cell viability of groups exposed to different concentrations of Quercetin alone, or combined with 80 µM Cisplatin for 48 hours was measured with CCK8 assay and expressed as percentage of control values. *P = 0.039, #P = 0.009, &P = 0.027, %P = 0.010, ANOVA test followed by post hoc pairwise comparisons. (B), Phase-contrast images of C13* cells treated with vehicle control (DMSO with the same dilution rate as the drugs), Cisplatin, or combination of Quercetin(20 µM,80 µM) with Cisplatin (80 µM). (C, D), Cell apoptosis of different treatment groups was detected and analyzed using flow cytometry. Experiments were performed in triplicate (N = 3 per experiment). Group of Cisplatin combined with Quercetin treatment VS. group of Cisplatin treatment, **P = 0.033, ***P = 0.043, ANOVA test followed by post hoc pairwise comparisons.

