Table 5. Comparison of various differentiation measures between two assemblages for an ultramteric distance matrix (Case I below) and a non-ultrametric distance matrix (Case II below).
| Measure | Ultrametric distance matrix (Case I) | Non-ultrametric distance matrix (Case II) |

|
1 (for all q≥0) | 1 (for all q≥0) |

|
1 (for all q≥0) | 1 (for all q≥0) |

|
0.6 | 0.826 |
|
1 | 0.559 |
|
1 | 0.388 |
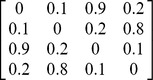
Assume the two assemblages are completely distinct. There are two equally common species (a, b) in the fisrt assemblage, and two equally common species (c, d) in the second assemblage. In the pooled assemblage, there are four species (a, b, c, d) with relative abundances (0.25, 0.25, 0.25, 0.25). As explained in the text, we expect that the differentiation for Case II should not be lower than that for Case I. See Appendix S5 for a non-completely-distinct case.
Case I: An ultrametric distance matrix for four species (a, b, c, d) with  = 0.125,
  = 0.05.
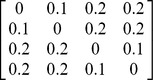
Case II: A non-ultrametric distance matrix for four species (a, b, c, d) with  = 0.288,
  = 0.05.