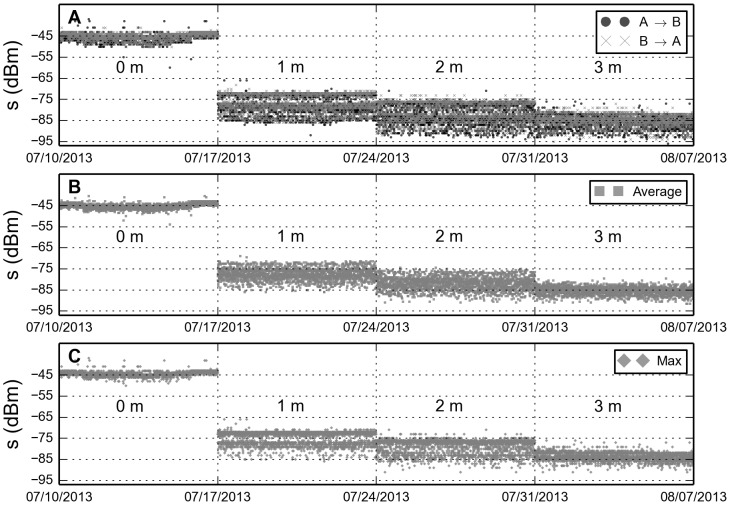
Figure 1. Bluetooth signal strength (RSSI) as a function of distance.
A: Scans between two phones. Measurements are per distance performed every five minutes over the course of 7 days. Mean value and standard deviation per distance are respectively 

 and
and  . B: Average of the values in respective time-bins. Summary statistics are:

 and
and  . C: Maximal value per time-bin. The mean value and standard deviation per distance are:
 ,
,  , and
, and  The measurements cover hypothetical situations where individuals are far from each other and on either side of a wall.

