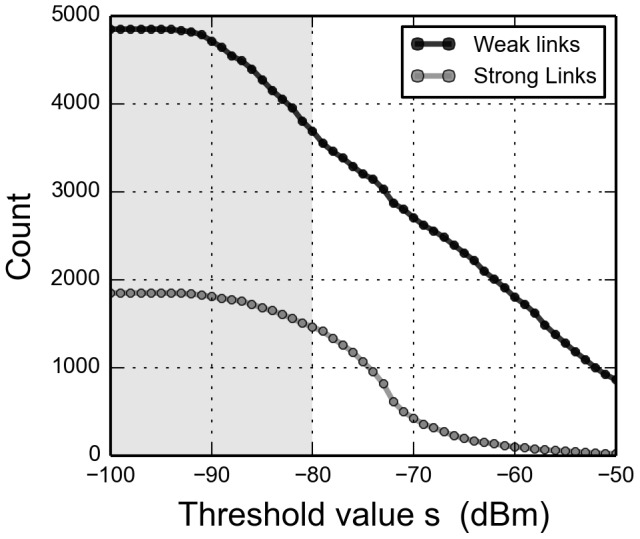
Figure 3. Number of links per type as a function of threshold value.

Links are classified as weak if they are observed less than  times in the data, i.e. links that on average are observed less than once per day—otherwise they are classified as strong. Grouping students into study lines, reveals that links within each study line have an almost uniform distribution of weights while links across study lines are distributed according to a heavy-tailed distribution. A threshold of
 (gray area) removes 1159 weak and 387 strong links and classifies
  of inter-study line links as weak and
  of intra-study line links as strong.
