
Figure 4. Networks.
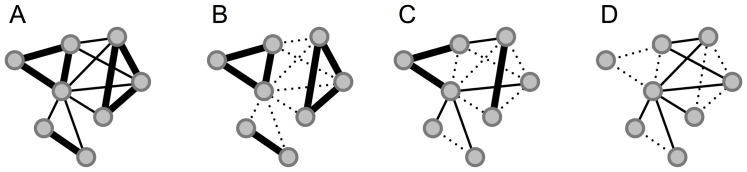
A: Raw network; shows all observed links for a specific time-bin. Thickness of a link symbolizes the maximum of the received signal strengths. B: Thresholded network, we remove links with received signal strengths below a certain threshold, where dotted lines indicate the removed links. C: Null model; with respect to the previous network we remove the same amount of links, but where the links are chosen at random. D: Control network, a similar amount of links with signal strength above or equal to the threshold are removed.