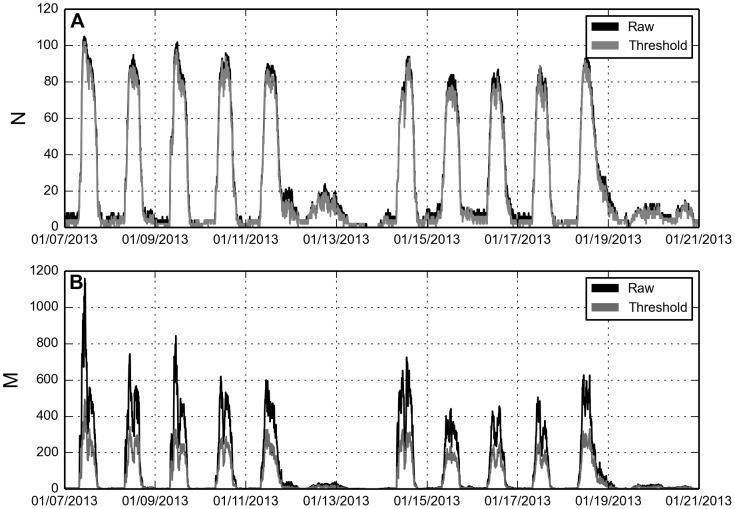
Figure 5. Network statistics.
Properties are highly dynamic but on average we observe  nodes and
  links per time-bin. A: Number of nodes
  as a function of time. Only active nodes are counted, i.e. people that have observed another person or been observed themselves. Dynamics are shown for two weeks during the 2013 spring semester, clearly depicting both daily and weekly patterns. Data markers are omitted to avoid visual clutter. On average thresholding removes
  nodes during weekends and holidays, and
  during regular weekdays. B: Number of links
  as a function of time.
  links are on average removed during weekends/holidays, and
  are removed during weekdays.

