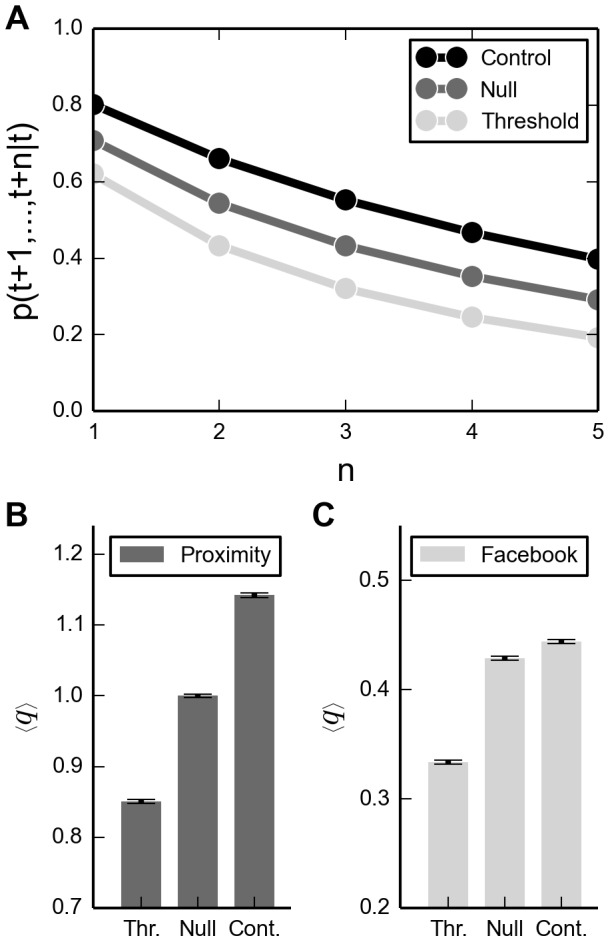
Figure 7. Link evaluation.

A: Probability of link reappearance. For each selection process we remove a specific set of links. In the thresholded network, we remove links with weak signal strength. For the null network, we remove links at random. Lastly, in the control network case we remove strong links. The probability for links to reappear within all the next  time-steps is calculated using Eq. 1 and averaging over all time-bins. Boundary conditions are not applied and the reappearance probability for the last
  bins is not taken into account. B: Quality measure for proximity data. C: Quality measure for the online data. For each time-bin we calculate
  as defined in Eq. 2 and 3. Brackets indicate a temporal average across all time-bins and value are shown for all three network types.
