Figure 1.
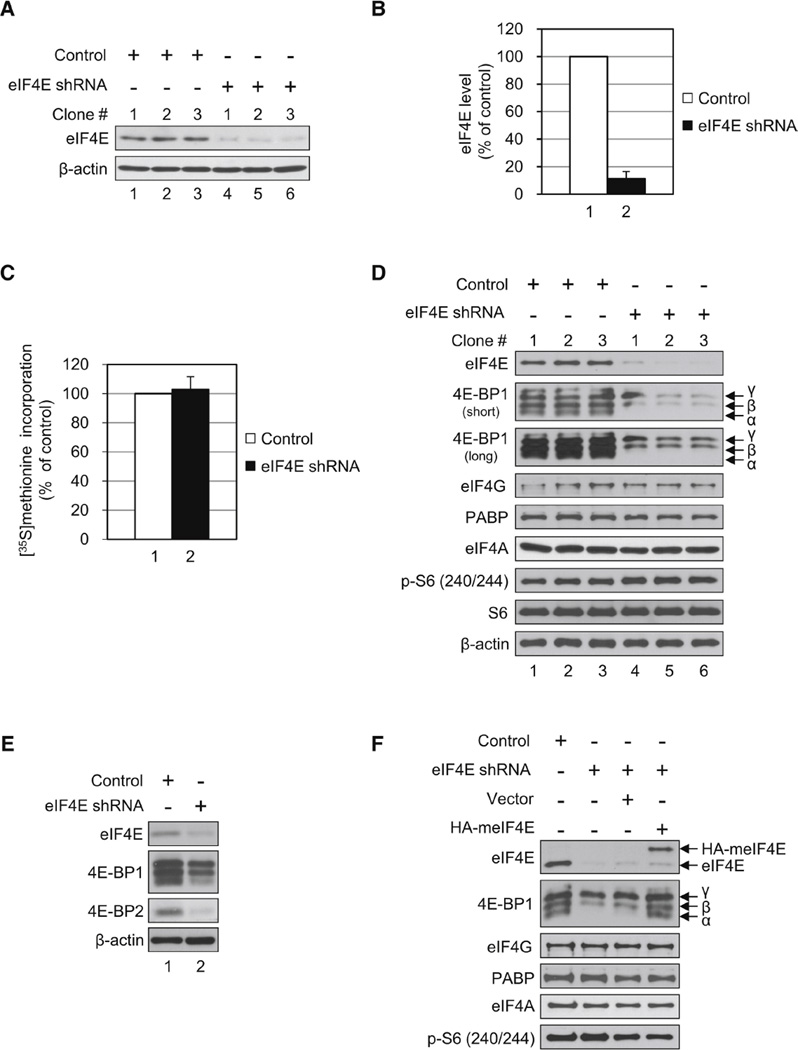
Translational Homeostasis in eIF4E-KD Cells Occurs Concomitantly with the Disappearance of the Hypophosphorylated 4E-BP1. (A) Control HeLa S3 cells expressing a scrambled shRNA sequence of eIF4E and cells expressing shRNA targeting eIF4E (eIF4E-KD) were generated. eIF4E and β -actin levels were determined by western blotting. (B) Quantification of KD levels of eIF4E from (A). eIF4E band intensities were measured using NIH ImageJ and normalized against β-actin. The value in control was set as 100%, and data are mean ± SD. (C) Effect of eIF4E KD on protein synthesis. Cells were incubated with [35S]methionine (10 µCi/ml) for 30 min. Radioactivity incorporated into 5% trichloroacetic acid-precipitated material was measured in a scintillation counter. The value in control was set as 100%, and data are mean ± SD of three separate experiments. (D) Protein levels of translation factors in eIF4E-KD as compared to control cells. Protein levels of the indicated proteins were analyzed along with phosphorylated rpS6 by western blotting. Short and long refer to exposure time against an X-ray film. (E) 4E-BP2 level is decreased in eIF4E-KD cells. 4E-BP2 was analyzed in control and eIF4E-KD cells as described above with an antibody specific for 4E-BP2. (F) Levels of the hypophosphorylated 4E-BP1 were maintained by expression of HA-tagged mouse eIF4E (meIF4E). A stable eIF4E-KD cell expressing HA-tagged meIF4E was generated, and protein levels of translation factors were analyzed by western blotting. See also Table S1.


