Figure 3.
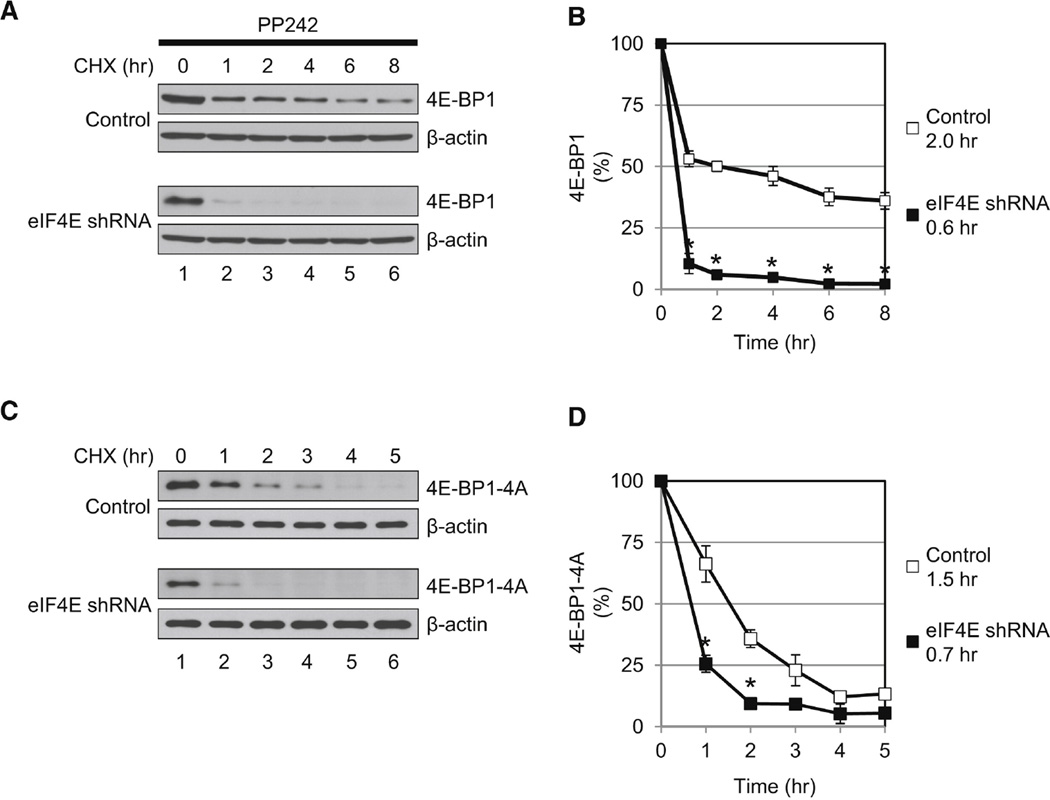
Half-Life of the Hypophosphorylated 4E-BP1 Is Reduced in eIF4E-KD Cells. (A) Half-life of the hypophosphorylated 4E-BP1 is shown. Control and eIF4E-KD cells were treated with 2.5 µM PP242 for 24 hr and then treated with cycloheximide (CHX) (100 µg/ml) for the indicated times. 4E-BP1 and β-actin levels were analyzed by western blotting. (B) Quantitative analysis of the hypophosphorylated 4E-BP1 amounts in (A). The intensities of the bands were measured using NIH ImageJ and normalized against β-actin. The intensity of the band at 0 hr (lane 1) is set as 100%. The half-life of the hypophosphorylated 4E-BP1 in control (2.0 hr) and in eIF4E-KD cells (0.6 hr) is indicated. (C) Half-life of the nonphosphorylatable 4E-BP1 mutant, 4E-BP1-4A, is shortened in the absence of eIF4E. Control and eIF4E-KD cells expressing 4E-BP1-4A were generated. Cells were treated with CHX (100 µg/ml) and harvested at the indicated times. 4E-BP1-4A and β-actin levels were determined by western blotting. (D) Quantitative analysis of 4E-BP1-4A in (C). The intensities of the bands were normalized against β-actin. The intensity of the band at 0 hr is set as 100%. The half-life of 4E-BP1-4A in control (1.5 hr) and eIF4E-KD cells (0.7 hr) is indicated. The data shown in (A) and (C) are representative of three experiments. Quantitative data with mean ± SD are shown in (B) and (D). *p < 0.05 using an unpaired Student’s t test.

