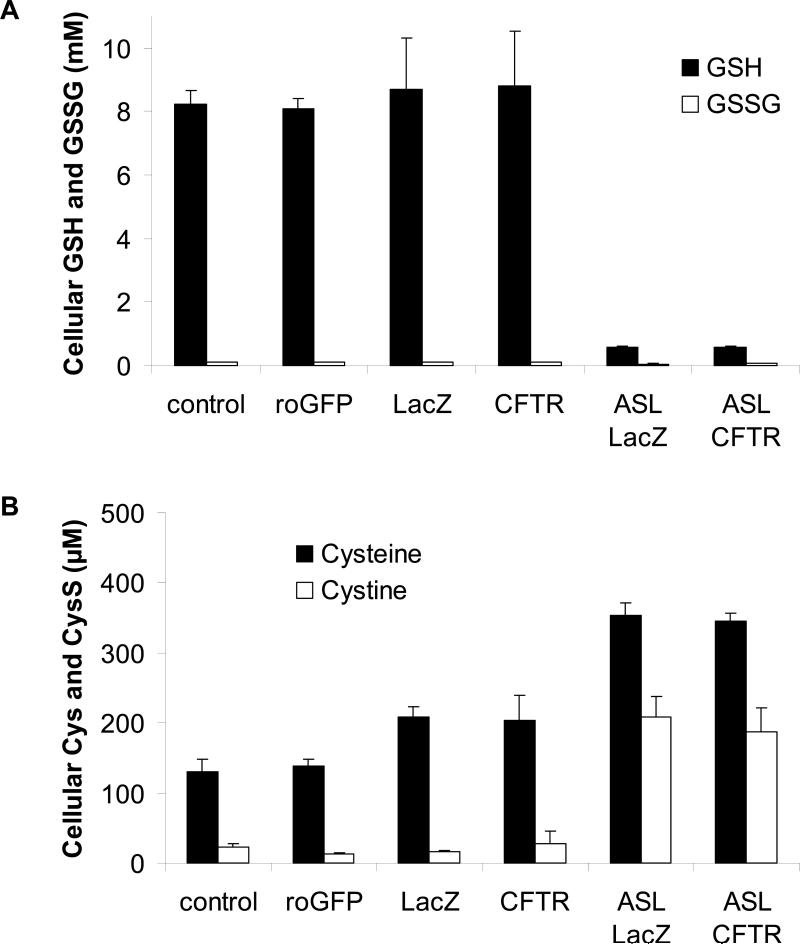
Fig. 11. GSH, GSSG, cysteine and cystine levels in cell lysates and apical secretion do not differ in CF15-lacZ and CF15-CFTR cells.
HPLC analysis of small redox-active molecules was performed on cell lysates of CF15 cells grown in tissue culture dishes and untreated, transfected with roGFP1 or infected with either Ad-lacZ or Ad-CFTR. Measurements on surface liquid was performed on cells grown on permeable supports and infected with Ad-lacZ or Ad-CFTR. A. Concentration of GSH and GSSG were detected by HPLC and are expressed as absolute concentration after adjustment to cell volume and dilution factor. The simultaneously performed analysis of cysteine and cystine from the same samples as in A is shown in B, Mean ± SD, n= 3.

