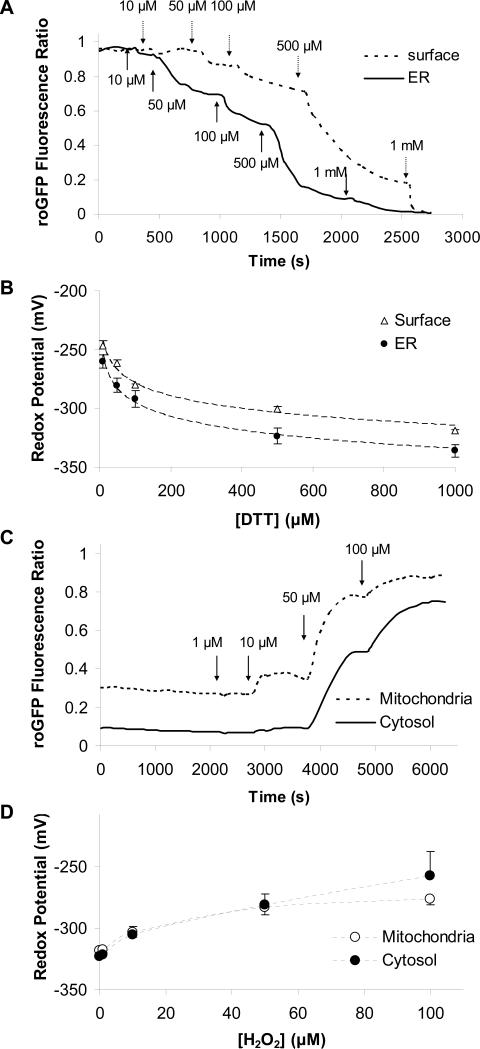
Fig. 5. Dose-dependent effects of DTT and H2O2 on redox potentials in the ER, surface, cytosol and mitochondria.
A. Cell surface and ER roGFP1 ratios were measured during exposure of cells to increasing [DTT] (10 to 1000 μM, additions shown by arrows). B. Background-subtracted, normalized ratios for mitochondrial and cytosolic roGFP1 were calibrated, and redox potentials were plotted against [DTT]. Data were then fit (dotted line) using redox potentials measured at 10, 50, 100, 500 and 1000 μM DTT by the equation y= a*ln(x)+y0. The intercept of this fitted line at 0 μM DTT suggests a redox potential of -217 mV in the ER and -206 mV at the cell surface. C. Mitochondrial and cytosolic roGFP1 ratios were measured during exposure of CF15 cells to increasing [H2O2] (1 to 100 μM, additions shown by arrows). D. Background-subtracted cytosolic and mitochondrial roGFP1 ratios were calibrated, and redox potentials were plotted as a function of [H2O2].

