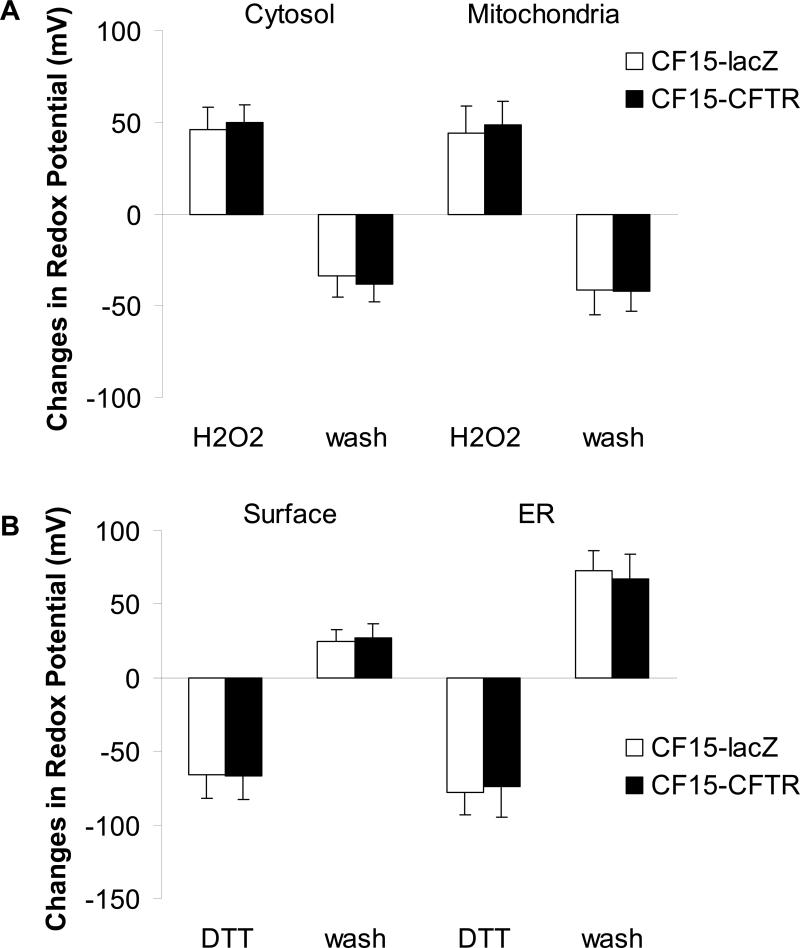
Fig. 8. CFTR does not affect redox potentials of cytosol, mitochondria, cell surface or ER upon H2O2 or DTT treatment.
CF15 cells expressing cytosolic or mitochondrial roGFP1 (A) and cell surface or ER roGFP1 (B) were analyzed 48 h post adenoviral CFTR/lacZ infection. Steady state redox potentials were recorded at the beginning of each experiment and after addition of 100 μM H2O2 (for the cytosol and mitochondria in A) or 500 μM DTT (for the cell surface and ER in B). Recovered redox potentials were recorded one hour after removal of H2O2 or DTT by washing cells with Ringer's solution. Shown are differences in redox potential obtained by subtracting initial or recovered redox potential values from those recorded after H2O2 or DTT treatment. Mean ± SD, n = 10.

