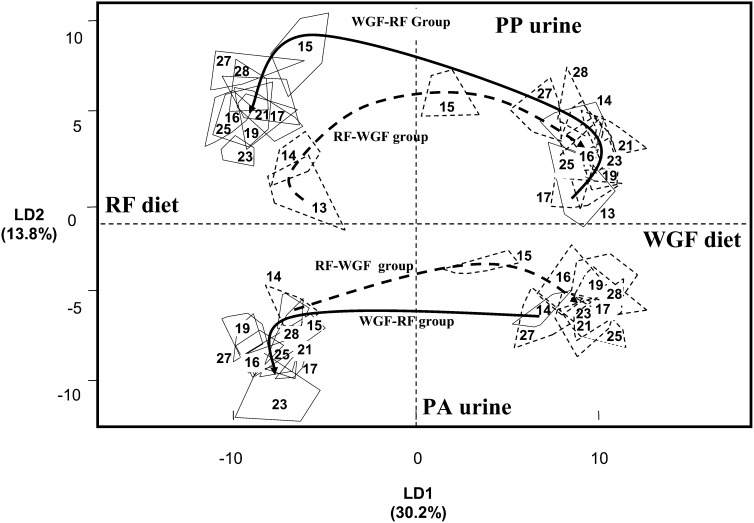
FIGURE 4.
LD analysis scores of urine 1H-NMR spectra highlighting the differences before, during, and after a dietary change (days 14–15) and between urine sampling times (PP and PA). Dashed lines, RF followed by WGF consumption (RF-WGF) group; solid lines, WGF followed by RF consumption (WGF-RF) group. Each polygon represents the limits of the metabolic profile (i.e., the whole set of metabolites) obtained for the 10 rats in a given group on a given day and urine sampling time. Urine samples were collected from days 13 to 28 (as shown within the figure). Reproduced from reference 87 with permission. LD, linear discriminant; PA, postabsorptive; PP, postprandial; RF, refined flour; WGF, whole-grain flour.

