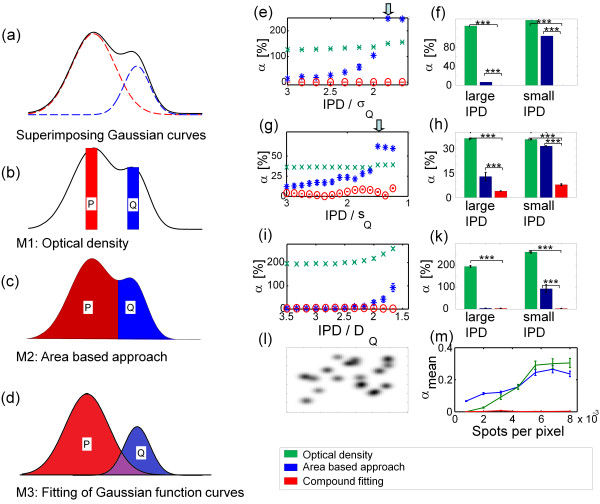
Figure 2.

Comparison of the different quantification approaches on simulated data sets – spot superposition. (a) Line profile of the inter-peak line of two superimposed simulated spots of Gaussian shape. Dashed lines: superimposed curves. Solid line: resulting signal. (b) - (d) Depiction of measures for spot quantification yielded by the three methods (b) The OD-based approach uses the heights of the spots for quantification (c) The area-based approach estimates the volumes of the spots over the assigned areas. In this two-dimensional scheme, the volumes are depicted as areas P and Q. (d) In our method, the function parameters of the fitted curves are used to calculate the VUSs of the spots. (e,g,i) Performance of the different quantification methods for two representative Gaussian-shaped (e), Lorentz-shaped (g) or diffusion model-based (i) spots at different extents of spot superposition. The error of quantification α (as defined in the methods section) increases with decreasing IPD for all quantification approaches. However, compound fitting is most robust to spot overlapping. At IPD ≈ 2 ⋅ σQ, an increasing deterioration can be noticed (arrow, see text). 200 images per data point. (f,h,k) Our method yielded a significantly smaller error of quantification than the two other approaches for Gaussian-shaped (f) and Lorentz-shaped (h) spots at small (IPD = 2σQ, 1.6sQ or 1.7DQ) and large IPD (IPD = 3.5σQ, 3sQ or 3.5DQ), but only at small IPD for diffusion model-based spots (k). (l) Example of simulated image area containing several Gaussian spots with a range of parameters (m) Performance of the three quantification methods on simulated images with an increasing density of Gaussian spots. αmean is a measure for quantification similar to α, adapted for the evaluation of several spots. (***: p < 0.001, unpaired two-sample t-test with Bonferroni correction). For details on data simulation, refer to Additional file 1.
