Figure 4.

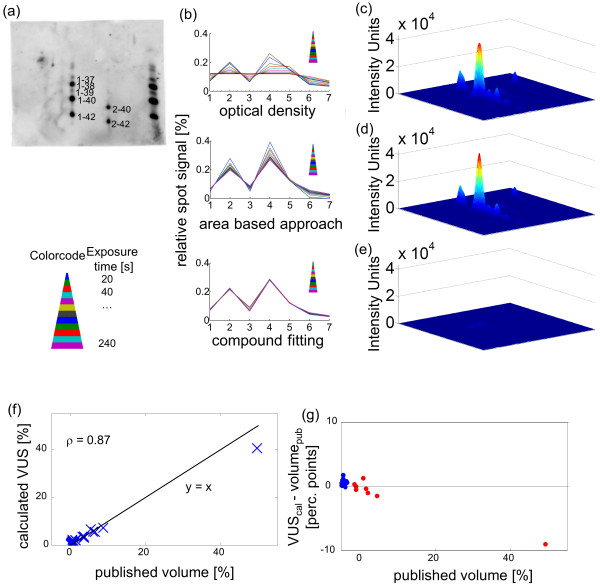
Application of compound fitting on real data. (a) One example blot of four blots of Aβ standard solutions. Aβ1–37/39 (30 pg, each), Aβ1–38/42 (60 pg, each), Aβ1–40 (120 pg), and Aβ2-40/42 (60 pg, each). (b) For one example of the four blots, the quantification of all images of the exposure time series is show. The relative spot signal (contribution of the spot signal to the overall signal of all spots combined) of the spots 1-7 was calculated in each of the 12 image of the exposure time series. One color is representative for one exposure time. It can be observed that compound fitting yielded the smallest variance of relative spot signal across the exposure time series. (c) 3-D surface plot of immunoblot image of Aβ peptides from human plasma. (d) Surface plot of the image calculated from the fitted Gaussian functions. (e) Residual image, difference between original and fitted image. (f) Correlation of the published volumes with the VUSs calculated from the fitted functions. The relative contribution of each spot to the over-all signal of the image (“total Aβ immunoreactivity“) is displayed. The published relative volumes for the 30 spots correlate well with our results, with a spearmancorrelation coefficient of ρ = 0.87. The black curve is the angle bisector. (g) Comparison of published volumes and calculated VUSs as a function of the spot intensity. With respect to the 8 most intense spots (red), our method yielded smaller relative VUS values than were published for 6 out of 8 spots, and higher values were obtained for 2 spots. In contrast, of the 22 lower-intensity spots (blue), our method calculated lower VUSs relative to the published data only for one spot, whereas it found the other 21 spots to be more intense than the published data.
