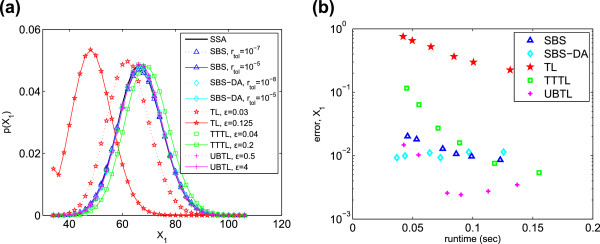
Figure 2.

Chain decay system. (a) PDFs of X1 generated from 5×10⁵ simulations. Only the PDFs of the most and least accurate error parameters are shown. (b) Histogram error of each method as compared to the PDF of X1 simulated with the SSA. Parameters varied are listed in Table 2.
