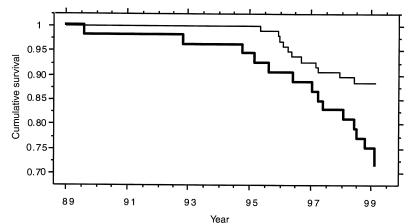
Figure 5.
Kaplan-Meier plot for 10 years, ranging from date of inclusion in 1989 to 1999, of survival rate of CF patients. Events are defined as date of death (n = 14) and lung transplantation (n = 12) (end-stage CF). Thin line indicates A/A patients, and thick line indicates variant allele carriers (A/0 and 0/0).

