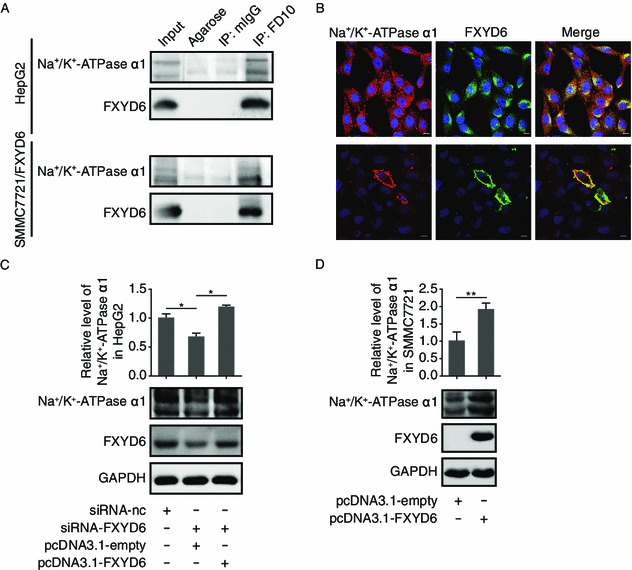
Figure 3.

FXYD6 associates with Na+/K+-ATPase in HCC. (A) Co-IP analysis of the interaction between FXYD6 and Na+/K+-ATPase α1 in HepG2 cells (upper panel) and in SMMC7721 cells transfected with pcDNA3.1-FXYD6 (lower panel). The immunoprecipitates were analyzed by immunoblotting with anti-Na+/K+-ATPase α1 and FD10 antibodies. (B) Co-localization analysis of FXYD6 and Na+/K+-ATPase α1 in same cell lines as described in (A) using double immunostaining with FD10 (green) and anti-Na+/K+-ATPase α1 (red). Nuclei were stained with DAPI (blue) and colocalization is indicated in yellow (bar, 10 μm). (C and D) Immunoblotting of Na+/K+-ATPase α1 subunit expression in HepG2 cells (C) after 48 h co-transfection with siRNA-FXYD6 and pcDNA3.1-FXYD6 or in SMMC7721 cells (D) after 48 h transfection with pcDNA3.1-FXYD6. Immunoblotting data from at least 3 independent experiments were measured with the band density, which were normalized to GAPDH. The signals from control cells were put to one. The bar graphs (mean ± SEM) and representative images are shown. *P < 0.05 or **P < 0.01, compared with the control
