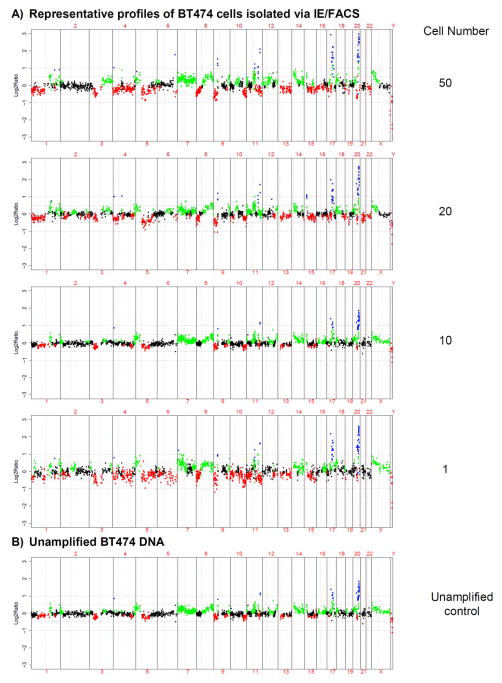
Fig. 1.
Copy number analysis of BT474 cells isolated via isolated via immunomagnetic enrichment and FACS (IE/FACS). (A) Representative ACGH profiles generated from 1 to 50 BT474 cells and (B) unamplified BT474 DNA positive control. The log2 ratio value for each BAC clone is plotted on the y-axis. The x-axis represents the genomic position of each BAC clone on the array, with chromosome numbers indicated. Vertical solid lines indicate chromosome boundaries, and vertical red dashed line represents the centromeric region dividing each chromosome into the p- or short arm (to the left of centromere) and the q- or long arm (to the right of the centromere). Color represents copy number status: red=loss, green=gain, blue=amplification, and black=no change.

