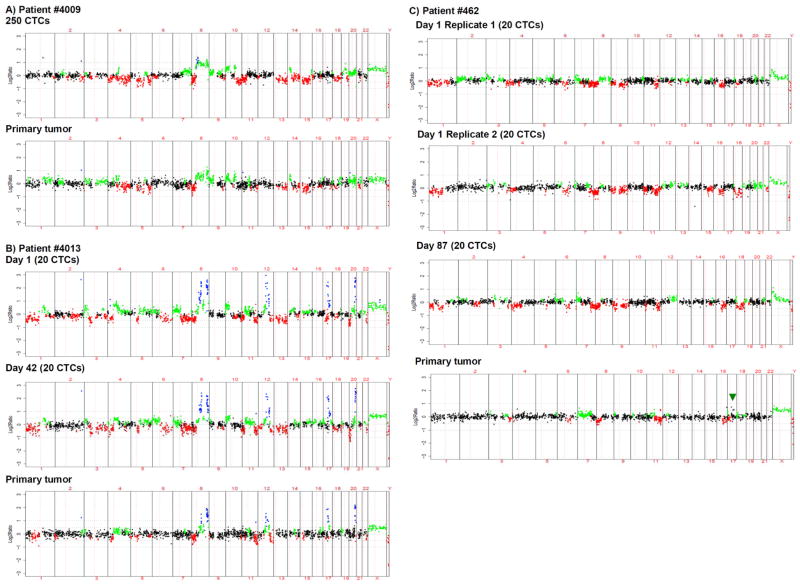
Fig. 5.
Copy number analysis of CTCs and matched primary tumor. (A) Profiles from 250 CTCs and the primary tumor of patient #4009. (B) Profiles from 20 CTCs isolated from two independent blood draws (days 1 and 42) and the primary tumor of patient #4013. (C) Genomic profiles from sorting replicates of 20 CTCs at day 1 isolated from the same blood sample, then amplified and arrayed independently as well as 20 CTCs at day 87 and the primary tumor of patient #462. The primary tumor showed a low level gain in HER2 (arrow).

