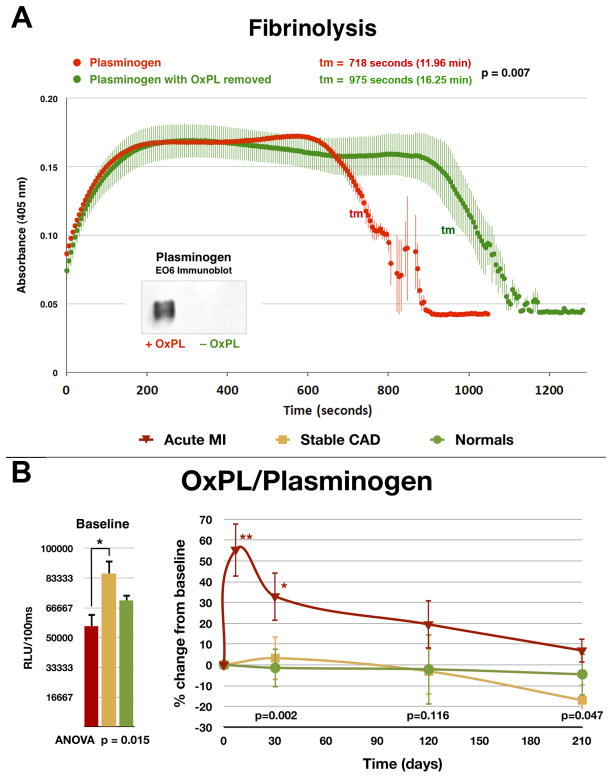
Figure 4. In vitro clot lysis assay assessing the ability of plasminogen to degrade fibrin clots.
Panel A- Native plasminogen containing OxPL and plasminogen with OxPL enzymatically removed (inset) with phospholipase A2 were used. Thrombin-induced clot formation occurs within the first 2 min and is marked by an initial rapid increase in turbidity, as measured by absorbance at 405 nm. Subsequent clot lysis is indicated by a rapid return of the turbidity signal to baseline levels. The parameter tm (transition midpoint) is taken as the standard measure of lysis time and is defined as the time point on the lysis curve that is halfway between the minimum and maximum excursions. The curves represent the mean±SEM of 3 separate experiments with measurement of absorbance at 405 nm every 5 seconds. Panel B- Baseline and change in plasma levels of plasminogen and OxPL/plasminogen in normal healthy subjects, patients with stable CAD and acute myocardial infarction (AMI) over 7 months. The p values at the bottom of the figures represent the hospital discharge (average of 4 days for the AMI group) and 30-, 120-, and 210-day differences between groups at each time point. *p < 0.05 and **p < 0.01 represent Bonferroni post-test for changes within groups over time. Reproduced with permission from reference [29].

