
Figure 6.
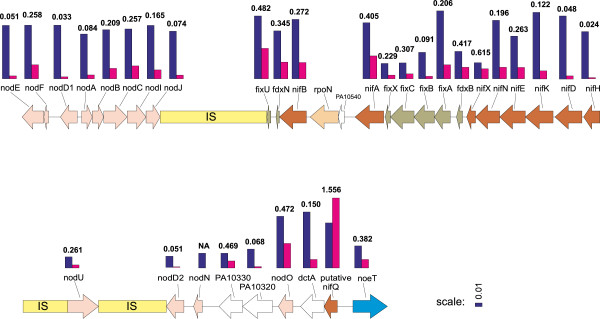
Illustration of d N / d S of the symbiosis genes of the two N. galegae strains. The HAMBI 540T symbiosis gene region used as model sequence. The blue bars represent the rate of synonymous substitutions d S, and the magenta-coloured bars the rate of nonsynonymous substitutions d N. The numbers on top of the bars are the d N/d S ratios.