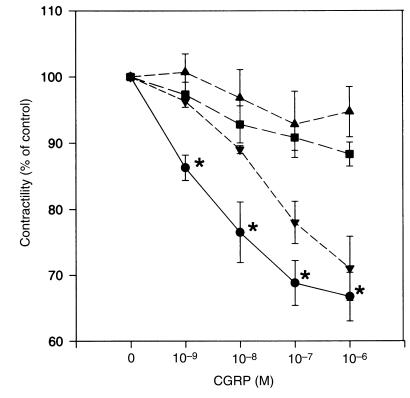
Figure 6.
CGRP dose-response curves for relaxation of spontaneously contracting myometrium from pregnant women not in labor. Relaxation responses (expressed as percent of control activity at each dose of CGRP) were analyzed by repeated-measures ANOVA among 4 groups (6 patients each): control (circles), CGRP8-37 (squares), LY83583 (triangles), and L-NAME (inverted triangles). Asterisks indicate a statistically significant difference vs. LY83583 and CGRP8-37 groups (P < 0.01 by ANOVA followed by Bonferroni t test).

