Figure 7.

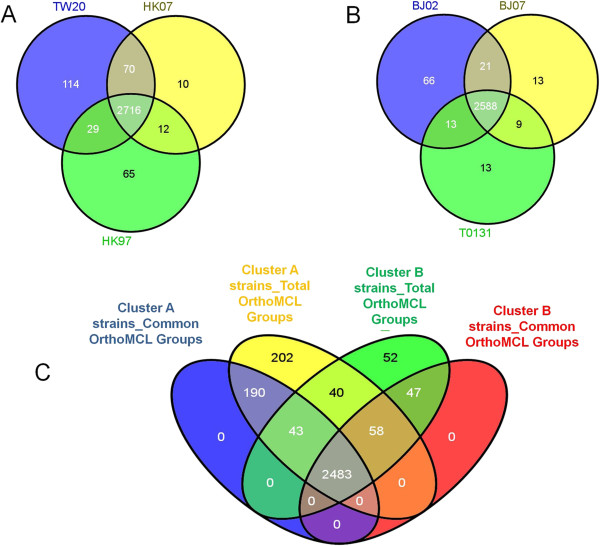
Venn diagrams showing the number of orthologous groups in the two clusters of ST239 genomes. (A) The common and unique orthologous groups among HK97, HK07 and reference TW20. (B) The common and unique orthologous groups among BJ02, BJ07 and reference T0131. (C) The relationship between Cluster A strains (HK97, HK07 and TW20) and Cluster B strains (BJ02, BJ07 and T0131). The overlapping blue ellipse shows 2,716 common orthologous groups present in all of Cluster A strains (i.e., HK97, HK07 and TW20). The overlapping yellow ellipse shows the orthologous groups present in at least one of the Cluster A strains. The red ellipse shows 2,588 common orthologous groups present in all of the Cluster B strains (i.e., BJ02, BJ07 and T0131). The green ellipse shows orthologous groups present in at least one of the Cluster B strains. The intersections of these four ellipses show the relationships of the identified orthologous groups in different genomes.
