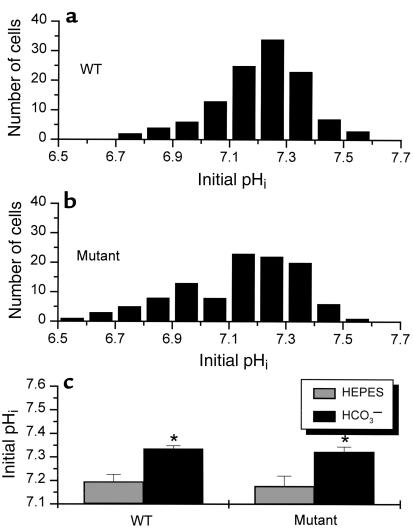
Figure 1.
Distribution of steady-state pHi in CA1 neurons isolated from WT and NHE1 mutant mice. (a) Steady-state pHi of CA1 neurons (n = 117) isolated from 57 WT mice is illustrated as a frequency histogram with a bin width of 0.1 pH unit. Mean ± SD of steady-state pHi for WT is 7.25 ± 0.15. (b) The distribution of steady-state pHi of CA1 neurons (n = 110) isolated from 61 NHE1 mutant mice is shifted to the left. Mean ± SD is 7.17 ± 0.20 (NHE1 vs. WT; P < 0.05). (c) In HEPES buffer, the steady-state pHi is significantly lower than in the CO2/HCO3–-buffered solution in both WT and mutant mice (*P < 0.05).

