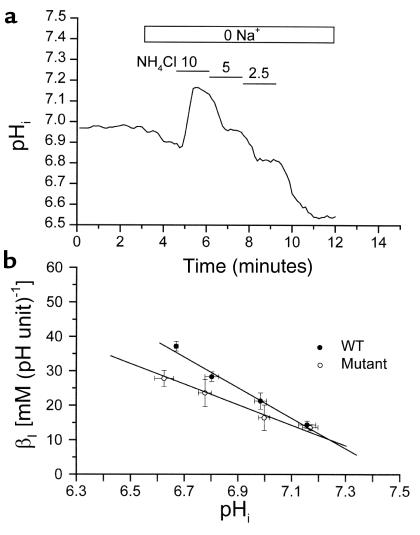
Figure 3.
Measurement of intrinsic intracellular buffering power. (a) Experiment on a WT CA1 neuron. The CA1 neuron was first bathed with HEPES buffer containing Na+, and then switched to one without Na+ to block the Na+-dependent ion exchange. The cell was subsequently exposed to 10 mM, 5 mM, 2.5 mM, and 0 mM NH3/NH4+, respectively. The cell responded by gradually reducing pHi. (b) Relation of intrinsic intracellular buffering power (βI) as a function of pHi. Data are summarized from 7 experiments on WT mice and 10 experiments on NHE1 mutant mice. Each βI was calculated within pHi intervals of 0.2.

