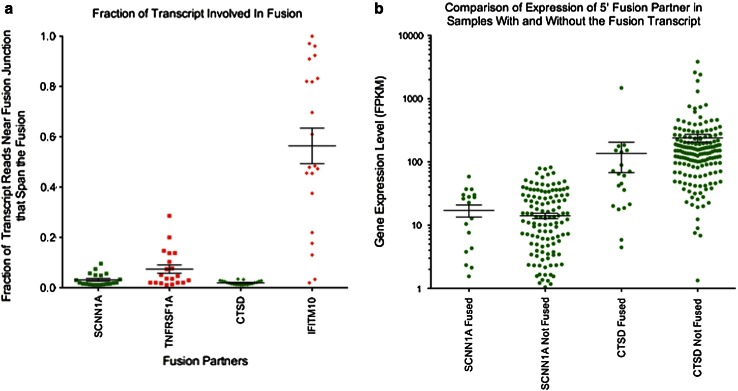
Fig. 2.
Expression of genes involved in breast cancer associated read-through fusion transcripts. a We computed the fraction of reads that include sequence from the fusion transcript rather than the un-fused canonical transcript. The fraction of fusion transcript reads for 5′ fusion partners are indicated in green, and the 3′ fusion partners are denoted in red for each of the samples. Mean and standard error of the mean are depicted in black. Less than 20 % of the 5′ fusion partners’ transcripts include the fusion sequence, indicating that most of the transcripts from the 5′ gene are not fused. A significantly larger fraction of the 3′ gene’s transcripts contain the fusion sequence (Mann–Whitney test: SCNN1A vs TNFRSF1A p = 0.0247, and CTSD vs IFITM10 p < 0.0001). b There is not a significant difference in the expression levels of the 5′ fusion partner between samples with or without the read-through fusion transcript (labeled fused and not fused, respectively). This indicates that increased expression of the 5′ fusion partner is not sufficient to induce read-through fusion transcripts that include the 3′ gene

