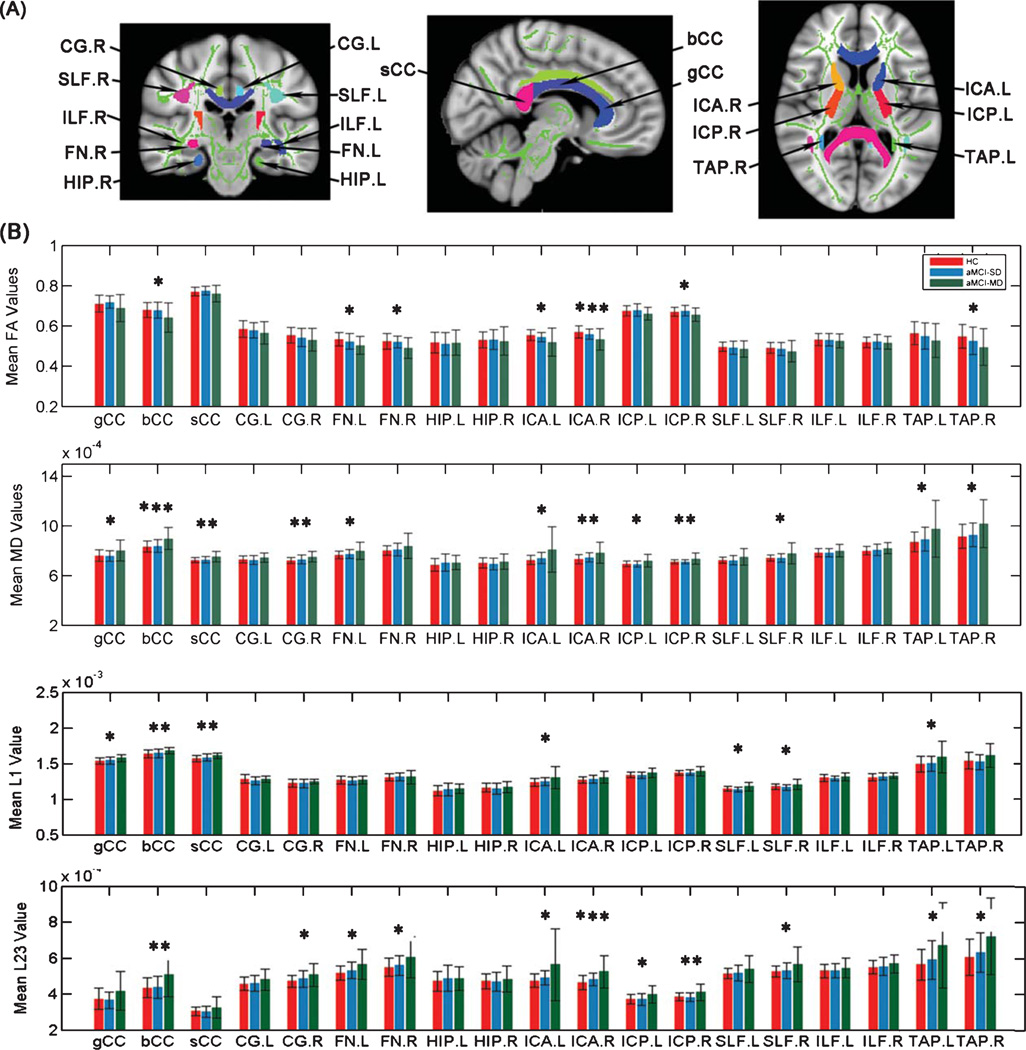
Fig. 2.
Mean diffusion metrics of the atlas-based tracts in the aMCI-SD, aMCI-MD, and control groups. A) The JHU-white matter atlas was overlaid on the mean WM skeleton in the ICBM-DTI-81 space. Colored regions indicate major WM tracts. The skeleton from averaged fractional anisotropy maps is shown as green solid curve. FA, fractional anisotropy; MD, mean diffusivity; L1, axial diffusivity; L23, radial diffusivity; gCC, genu of corpus callosum; bCC, body of corpus callosum; sCC, splenium of corpus callosum; CG, cingulum bundle at cingulate gyrus; FN: fornix; HIP: hippocampus; ICA: anterior internal capsule; ICP: posterior internal capsule; SLF: superior longitudinal fasciculus; ILF: inferior longitudinal fasciculus; TAP: taptum. B) Group differences of the mean diffusion metrics of the atlas-based tracts among the aMCI-SD, aMCI-MD, and HC groups. *p < 0.05; **p < 0.01; ***p < 0.05 after Bonferroni correction.

