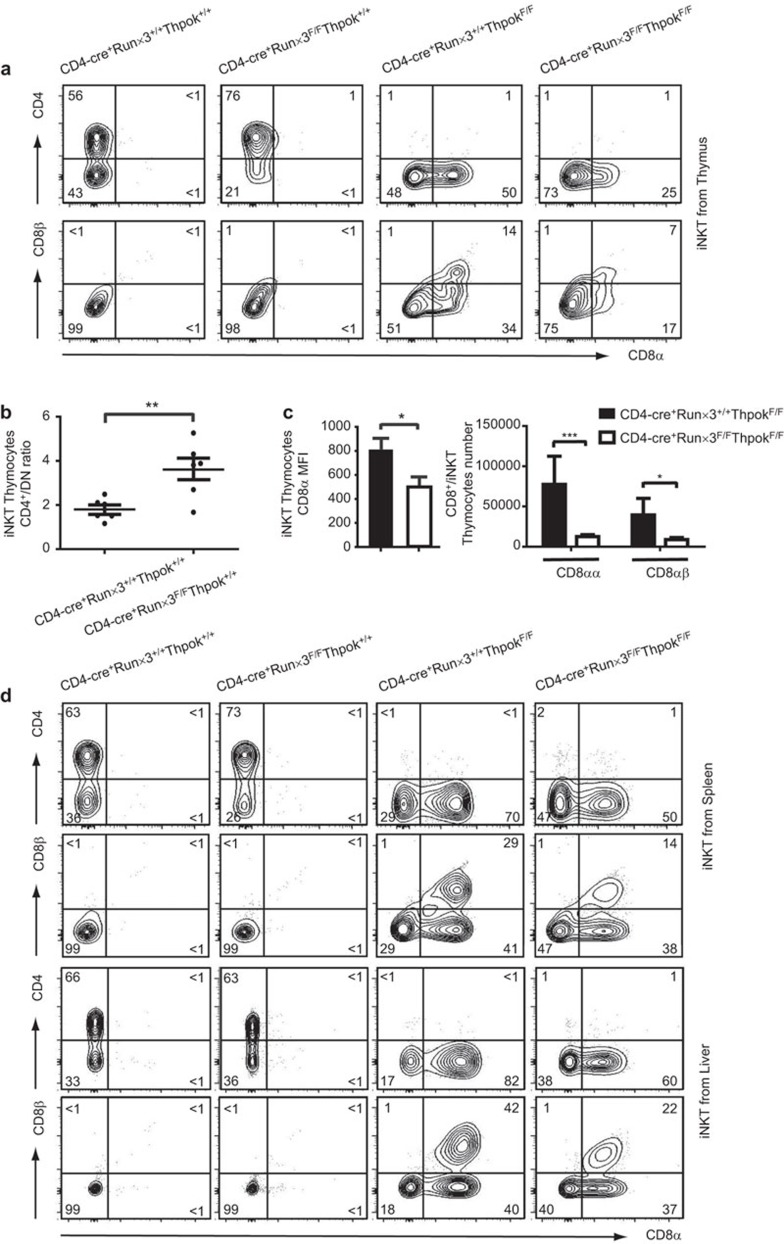
Figure 2.
Characterization of iNKT cells in Runx3-deficient, ThPok-deficient and DKO mice. (a) αGalCer CD1d+TCRβ+ iNKT cells from the indicated mice were identified from the total thymocyte population and then stained with CD4 versus CD8 to differentiate subsets as shown in the first panel. iNKT cells shown in the bottom panel were further stained with CD8α and CD8β for a more detailed analysis. (b) The ratios of CD4+/DN iNKT cells in the thymi of Runx3-deficient and WT mice were calculated from six separate experiments. Each plot represents an individual mouse. P values were determined by a paired, two-tailed Student's t-test, and statistically significant differences are marked (*P<0.05, **P<0.01, ***P<0.001). (c) The bar graphs show the MFI of CD8α molecules (left) in ThPok-deficient and DKO mice. The absolute numbers of CD8αα+ or CD8αβ+ iNKT cells from ThPok-deficient (filled bars) and DKO (open bars) mice (n=8) are shown in succession (right). Error bars indicate s.e.m. and significance is indicated (*P<0.05, **P<0.01, ***P<0.001). Results are representative of eight independent experiments. (d) Flow cytometric analysis of peripheral iNKT cells in the indicated mice. The upper panels display CD4 and CD8 expression in iNKT cells gated on αGalCer-loaded CD1d+TCRβ+ splenocytes of the indicated mice. The splenic iNKT cells were further stained with CD8α and CD8β (second panel). Liver MNCs were isolated and stained with αGalCer-loaded CD1d tetramer, anti-TCRβ, anti-CD4 and anti-CD8 (third panel). These cells were assessed for CD8α and CD8β expression for further analysis (bottom panel). Numbers in each quadrant show the percentage of each subpopulation of iNKT cell. αGalCer, α-galactosylceramide; DKO, double knockout; iNKT, invariant natural killer T; MFI, mean fluorescence intensity; MNC, mononuclear cell; Runx3, runt-related transcription factor 3; TCR, T-cell receptor; WT, wild-type.

