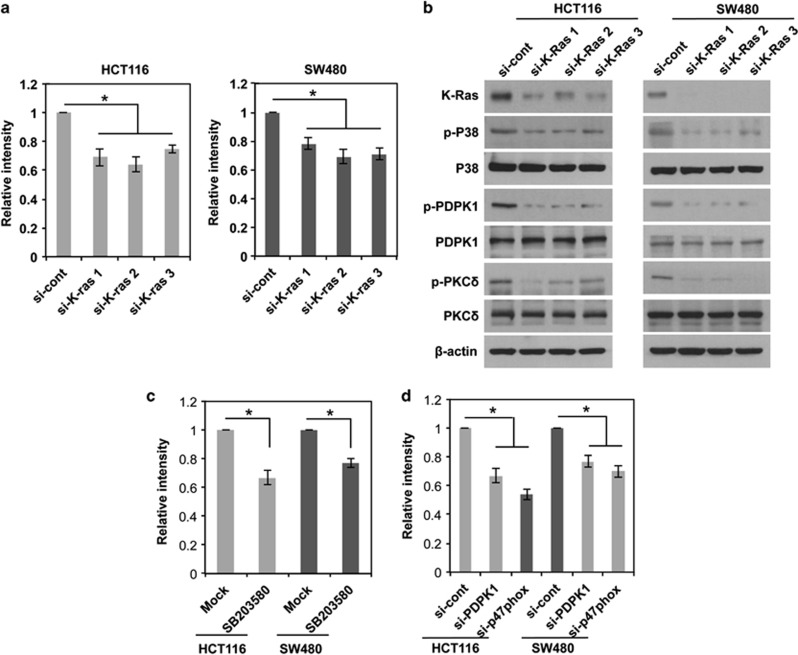
Figure 7.
K-Ras-induced ROS generation in human cancer cell lines, driving the same signaling pathway as in normal fibroblasts. (a) Levels of ROS as assessed by DCFDA fluorescence in HCT116 and SW480 after transfection with three different siRNA-targeting K-Ras. (b) Western blot for activation status of p38, PDPK1, and PKCδ after transfection with three different siRNA-targeting K-Ras. (c and d) Levels of ROS as assessed by DCFDA fluorescence after treatment with SB203580, inhibitor specific to p38 MAPK (c) or siRNA targeting PDPK1 or p47phox (d) in HCT116 and SW480. Error bars represent mean±S.D. of triplicate samples. *P<0.001

