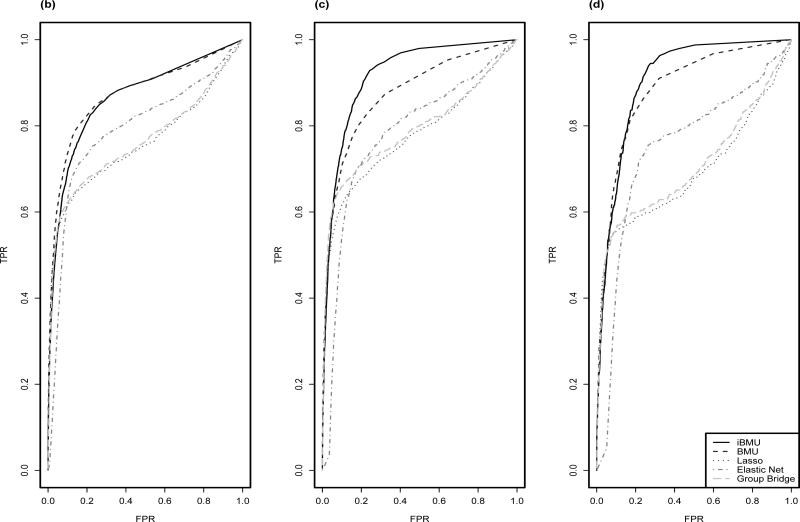
Figure 2.
ROC curves are calculated under BMU and iBMU by varying the MargBF threshold that determines which predictor variables are associated with the outcome of interest and are calculated under the penalized regression approaches by varying the value of λ. Given each threshold, the corresponding FPR is plotted on the x-axis and TPR is plotted on the y-axis. Plot a) corresponds to α = 0 for all predictor-level covariates, b) corresponds to α > 0 for a informative gene-based dichotomous covariate and c) corresponds to α > 0 for the informative continuous covariate.

