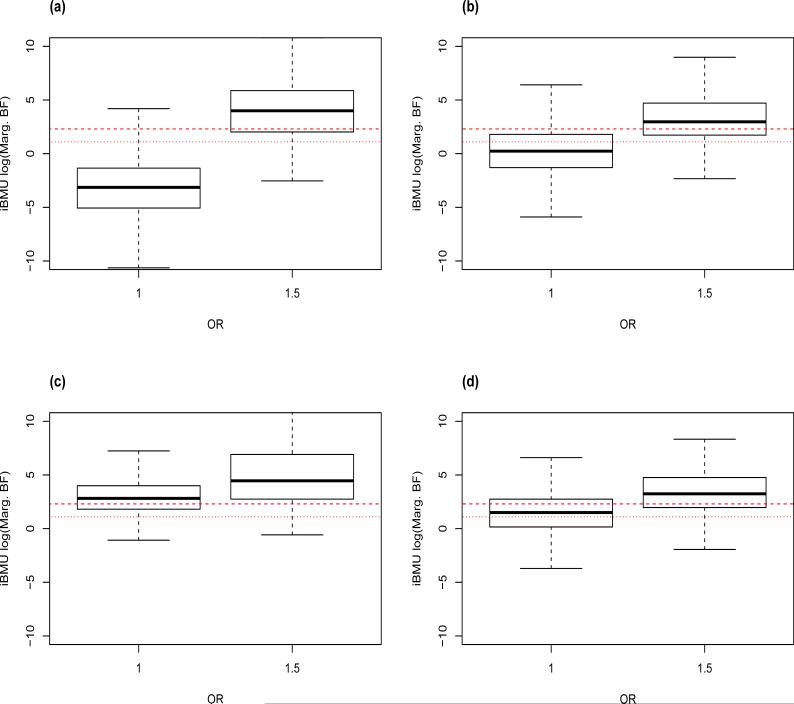
Figure 4.
The log(MargBF) are plotted against the true OR for predictors in simulations that assume that associations are informed by a continuous predictor-level covariate. Plot a) corresponds to the log(MargBF) computed under iBMU for predictors with a continuous covariate less than 1, b) for predictors with a continuous covariate greater than 1 but less than 3, c) for predictors with a continuous covariate greater than 3, and d) for predictors within the group corresponding to gene CHRNA5.

