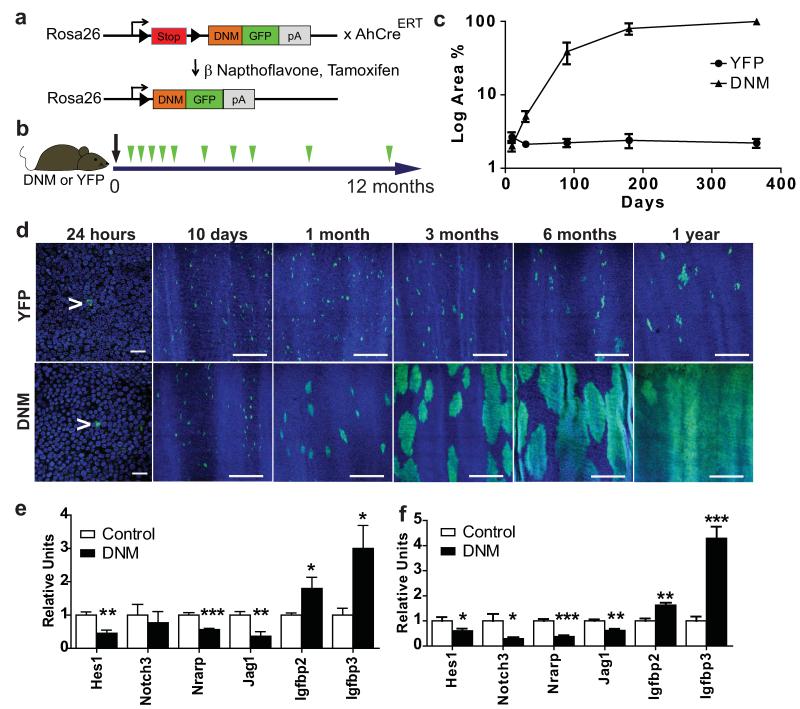
Figure 1. Notch inhibition by DNM leads to clonal expansion.
a: Dominant negative mastermind (DNM) mouse. The Notch binding domain of Maml1 (orange) is fused to GFP (green) and targeted to the Rosa26 locus downstream of a ‘stop’ cassette (red). Following cre induction the stop cassette is excised and DNM protein expressed in a small proportion of oesophageal basal cells. In the control strain, Yellow Fluorescent Protein (YFP) is similarly targeted to the Rosa26 locus. b: Protocol: Clonal labelling was induced in AhcreERTR26flDNM/wt (DNM) and control AhcreERTR26flEYFP/wt (YFP) mice, and samples taken from 24 hours to 1 year post induction (green arrows). c: Quantification of area recombined epithelium over time. Three images were analysed from each of three mice at each time point for each mouse strain. d: Rendered confocal z stacks of OE showing ‘top down’ views of typical areas of wholemounts at times indicated, green indicates DNM or YFP, blue is Dapi. Scale bars, 50μm in 24 hour panels and 300μm in other panels. Arrows indicate single recombined cells. e,f: QRT-PCR of Notch regulated transcripts in OE, relative to Gapdh mRNA. e: Flow sorted DNM expressing basal cells compared with control DNM negative basal cells at 15 days post induction. f: Unsorted epithelium from induced DNM mice compared with age matched, uninduced, DNM control mice 1 year post induction. Values are means of 5 (control) or 6 (DNM) independent biological repeats at each time point, normalized to control (=1). Error bars are SEM *, p< 0.05; **, p < 0.01; ***, p< 0.001 by t test.

