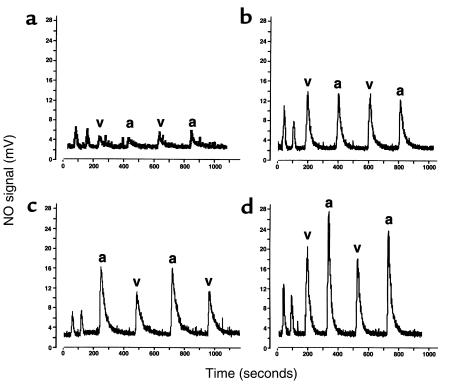
Figure 5.
Chemiluminescent detection of NO released from hemoglobin reacted in I3– before and after dose escalation of inhaled NO. NO signal is measured in millivolts (y-axis), and time is measured in seconds (x-axis). (a) Sample measurements before NO inhalation are shown. The first 2 peaks are from 200 μL of water collected from the G25 column immediately before use. The following 4 peaks are from 200 μL of lysed desalted hemoglobin from the venous (v) and arterial (a) blood injected in duplicate in alternating sequence. An arterial-venous difference is not appreciated, and the signal is very low (0.0035% moles NO per moles heme subunit; calculated by dividing the area under the curve [after subtraction from G25 water] from each injection by the concentration of hemoglobin in the sample, multiplied by 100). (b) The signal obtained after breathing 40 ppm NO gas for 1 hour. The venous (0.014%) and arterial (0.011%) nitrosylated hemoglobin levels have risen. (c) The signal obtained after breathing 60 ppm NO gas for 1 hour exhibits a difference between the arterial (0.02%) nitrosylated hemoglobin level and the venous (0.014%), although this difference was not observed in all patients studied. (d) Inhalation of 80 ppm NO further increased the arterial-venous difference (arterial 0.024% and venous 0.017%). This difference was observed in all 3 individuals studied.

